Key Components
of DAWN ATMs
01
The Data Input Layer
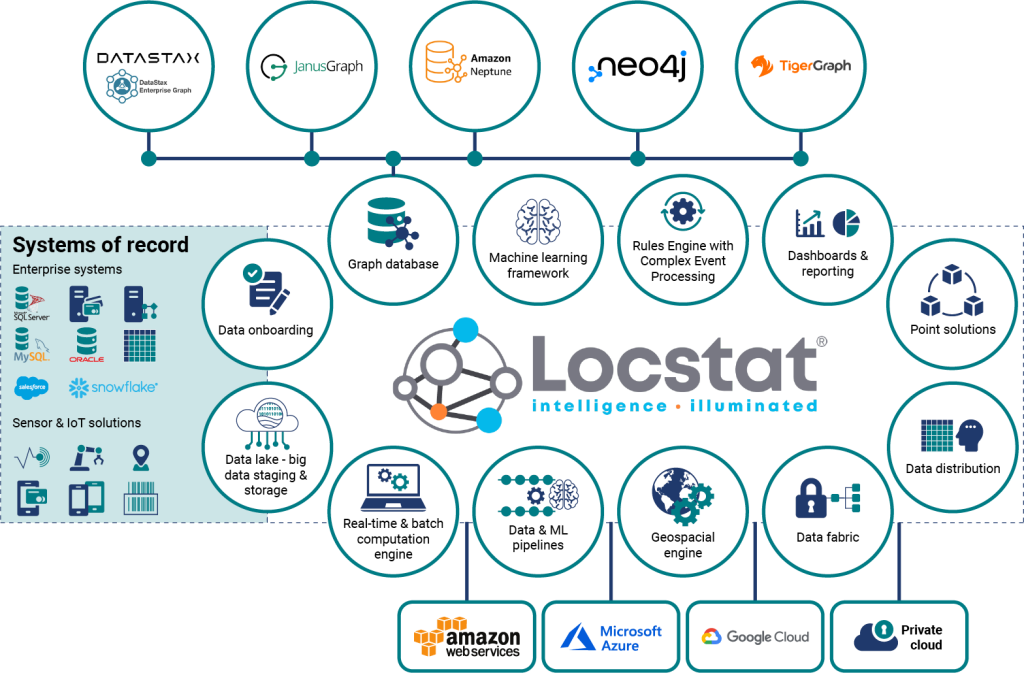
This is where the ATMS collects and aggregates transaction data from various sources, such as banking systems, credit card processors, and payment gateways. The solution seamlessly integrates disparate data sources from internal systems and external regulatory bodies, including structured and unstructured data. This comprehensive integration ensures real-time access to all relevant data for advanced analytics.
02
Data Orchestration Layer
The Data Orchestration Layer is where data orchestration and the pipelining of curated data streams occur in a high-volume, high-velocity, and complex transaction environment. Locstat's® proprietary tech unlocks the ability to create multiple curated, rolled-up, and graph-feature-engineered data pipelines (‘streams'), which can be used for rules monitoring in Locstat’s® Complex Event Processing rules engine.
03
Detection Engine
The Detection Engine is the core of ATMS. It is where rules and algorithms are applied to transaction data for real-time monitoring. It analyses both historical data and current transactions in real-time or batch format. Locstat® combines a low-code Complex Event Processing (CEP) rules engine with graph analytics to efficiently identify suspicious activities and regulatory breaches. It adapts to evolving threats and provides robust, cost-effective protection against financial fraud and compliance risks. All FICA rules are applied out of the box.
04
Alert Management Module
The Alert Management Module component is the workflow layer that handles the generation, prioritisation, and reporting of alerts to the relevant teams for further investigation. It allows users to track the status of investigations. Complex trends and patterns across accounts and multiple channels can be monitored to identify indicator patterns, relationship/connectivity anomalies, and money-flow trends, as well as emerging risks, enabling faster and more informed decision-making.

05
Case Management
The Case Management system helps compliance officers track the life cycle of alerts and investigations, documenting actions taken, and decisions made regarding them.
06
Dashboards and Reporting Tools
This visualise transaction data, alerts, and patterns, helping analysts and compliance teams make informed decisions quickly. Customisable reports are also generated for audits or regulatory submissions. The system uses Graph Visual Analytics for intuitive exploration and analysis, representing data as interconnected graphs. The solution is fully API and message queue integration enabled. Alerts, notifications, reports, and soft/hard block-action from events generated by the solution protect against reputational risk and greatly reduce false positives.

